Group Analytics
Track your community's growth with detailed insights and metrics.
Group Analytics gives you insights into your community's growth and engagement. Track membership trends, event attendance, and identify what's working best for your group.
Accessing analytics
To view your group's analytics:
- 1Navigate to your group's page
- 2Click the
Analyticslink in the admin tools section
Pro Feature: Group Analytics is available on the Pro plan. Upgrade your group to access detailed insights.
Key metrics
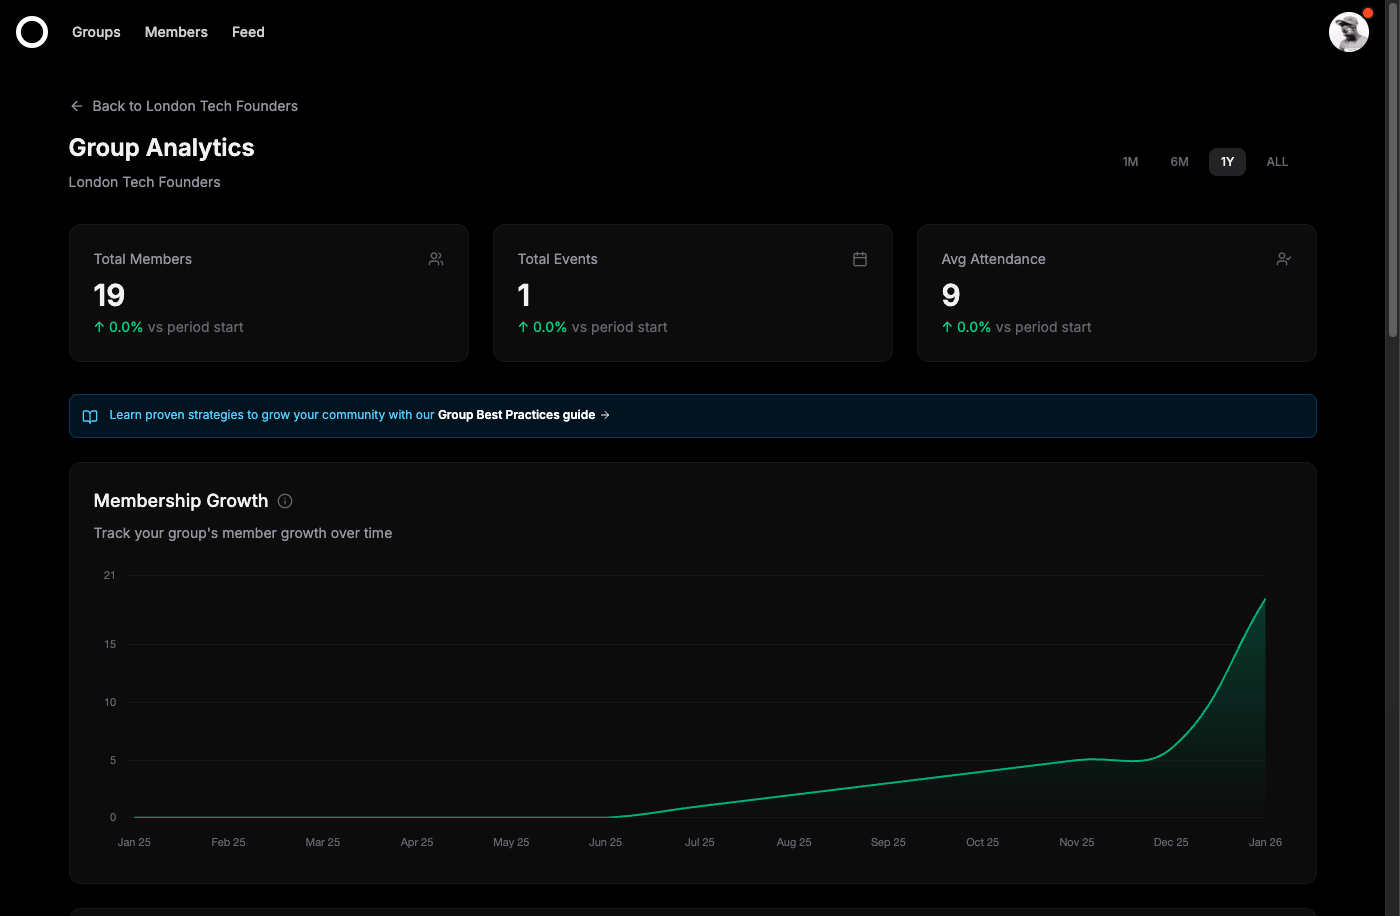
The analytics dashboard shows three key metrics at a glance:
| Metric | Description |
|---|---|
Total Members | The current number of members in your group, with growth percentage compared to the start of the selected period |
Total Events | The number of events hosted during the selected time period |
Avg Attendance | The average number of attendees per event |
Charts and trends
Below the key metrics, you'll find three interactive charts that visualize your group's performance over time:
Membership Growth
Track how your member count has changed over time. This chart shows the cumulative number of members at each point, helping you identify growth trends and the impact of events or campaigns.
Events Over Time
See how many events you've hosted each month. Use this to understand your event cadence and identify periods of high or low activity.
Event Attendance
Monitor the average attendance for events each month. This helps you understand engagement levels and which types of events attract the most attendees.
Time ranges
Filter your analytics data using the time range selector in the top right:
| Range | Description |
|---|---|
| 1M | Last 1 month of data |
| 6M | Last 6 months of data |
| 1Y | Last 12 months of data |
| ALL | All available data (up to 24 months) |
Next steps
Use your analytics insights to improve your community:
Host more events
Increase engagement with regular events.
Grow your membership
Invite more people to join.
Optimize your group
Improve your group's profile.
Export reports
Download your analytics data.
Coming soon